
19.04million
Total passenger movements
FY ended 30 Jun 2026
Up 1.6% from FY25. S1
Citation-ready research · Updated 26 September 2026
82 current passenger, visitor, airline, cargo, infrastructure and peak-travel facts, traced to Auckland Airport and Stats NZ primary sources.
Editorial note: Henderson Taxi independently compiled this resource for writers, researchers and travellers. We are not Auckland Airport or Stats NZ. “Passengers” and “travellers” generally mean movements, not unique people. Forecast figures are explicitly labelled expected or planned.
Key takeaways
19.04million
FY ended 30 Jun 2026
Up 1.6% from FY25. S1
8.57million
FY ended 30 Jun 2026
Up 1.7% from FY25. S1
10.47million
FY ended 30 Jun 2026
Up about 2% from FY25. S2
0.66million
FY ended 30 Jun 2026
Down 3.8% from FY25. S1
157,618movements
FY ended 30 Jun 2026
Approximately flat year on year. S1
173,880tonnes
FY ended 30 Jun 2026
Up 3% from FY25. S1
25,000jobs
2026 snapshot
Across aviation, retail, logistics and hospitality. S1
NZ$39.5billion
2026 report
EY Auckland Airport Economic Analysis, cited by the airport. S1
60years
1966–2026
Opened 29 January 1966. S3
458million
1966–2025
Cumulative figure reported for the 60th anniversary. S3
38million
Late 2040s forecast
Master Plan forecast. S7
3.69million
Year ended Jul 2026
Up 305,000 from the July 2025 year. S4
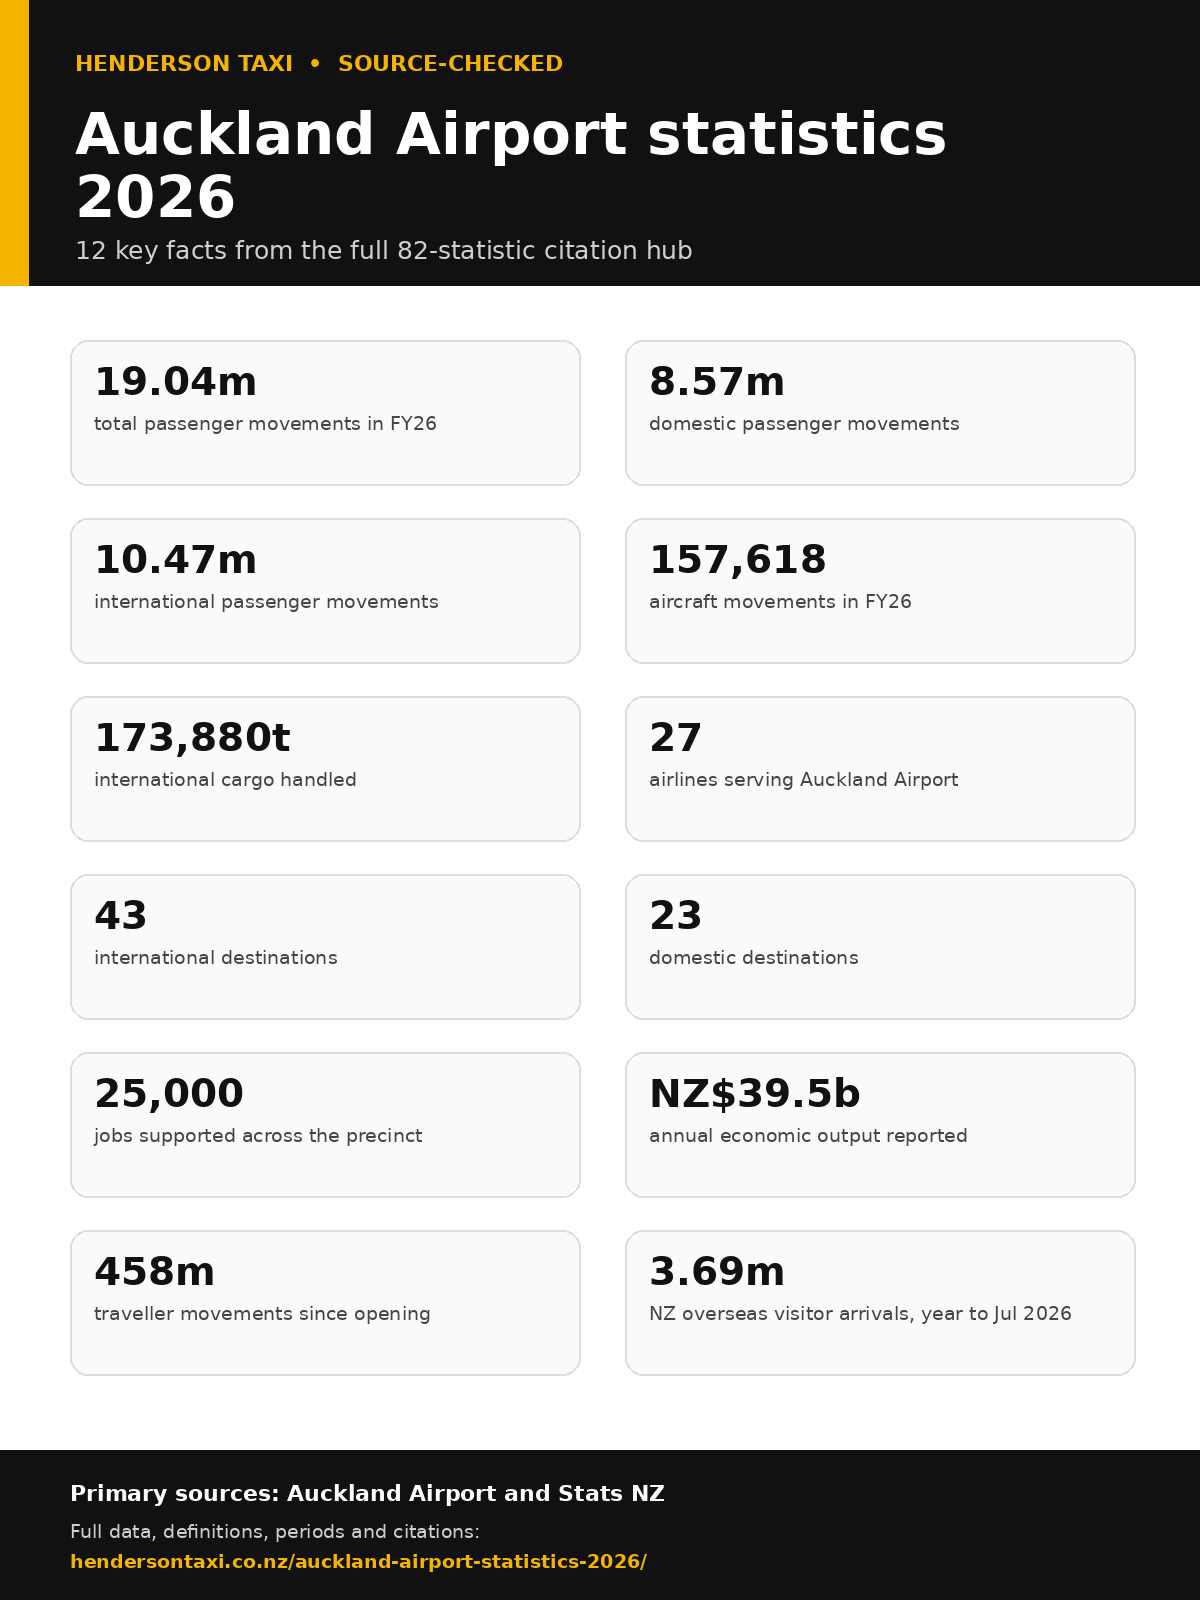
Free to share
You may republish this image with a visible credit and link to this data page. The full table below supplies the period, definition and primary source behind every figure.
Download infographic (.png)Methodology
Every figure links to the organisation that produced or published it. We prioritised Auckland Airport annual reports, official traffic updates and Stats NZ releases. We did not copy figures from third-party statistics roundups.
FY26 passenger traffic
Auckland Airport handled 19.04 million passenger movements in FY26, split between 8.57 million domestic and 10.47 million international movements. S1
| Period | Measure | Reported figure | Context and source |
|---|---|---|---|
| FY ended 30 Jun 2026 | Total passenger movements | 19.04 million | Up 1.6% from FY25. S1 |
| FY ended 30 Jun 2026 | Domestic passenger movements | 8.57 million | Up 1.7% from FY25. S1 |
| FY ended 30 Jun 2026 | International passenger movements, including transit | 10.47 million | Up about 2% from FY25. S2 |
| FY ended 30 Jun 2026 | International transit passenger movements | 0.66 million | Down 3.8% from FY25. S1 |
| FY ended 30 Jun 2026 | Aircraft movements | 157,618 movements | Approximately flat year on year. S1 |
| FY ended 30 Jun 2026 | International cargo handled | 173,880 tonnes | Up 3% from FY25. S1 |
Network and operations
In FY26, 27 airlines connected Auckland with 43 international and 23 domestic destinations, while reported processing times improved across all four measured passenger flows. S1
| Period | Measure | Reported figure | Context and source |
|---|---|---|---|
| FY ended 30 Jun 2026 | Airlines serving Auckland Airport | 27 airlines | Annual-report snapshot. S1 |
| FY ended 30 Jun 2026 | International destinations served | 43 destinations | Non-stop network snapshot. S1 |
| FY ended 30 Jun 2026 | Domestic destinations served | 23 destinations | New Zealand network snapshot. S1 |
| FY ended 30 Jun 2026 | International departure processing-time improvement | 15.6 percent | Median processing times improved year on year. S2 |
| FY ended 30 Jun 2026 | Domestic departure processing-time improvement | 7.0 percent | Median processing times improved year on year. S2 |
| FY ended 30 Jun 2026 | International arrival processing-time improvement | 1.9 percent | Median processing times improved year on year. S2 |
| FY ended 30 Jun 2026 | Transit processing-time improvement | 7.0 percent | Median processing times improved year on year. S2 |
| FY ended 30 Jun 2026 | Voice of Customer satisfaction score | 4.4/5 score | Auckland Airport customer programme. S2 |
| FY ended 30 Jun 2026 | Airport Service Quality customer satisfaction | 83.5 percent | Reported in the FY26 results presentation. S2 |
| FY ended 30 Jun 2026 | Voice of Customer responses | 20,000+ responses | Responses collected during FY26. S2 |
Airport scale and economy
The airport precinct supported 25,000 jobs and 300+ businesses, with Auckland Airport reporting NZ$39.5 billion in annual economic output. S1
| Period | Measure | Reported figure | Context and source |
|---|---|---|---|
| 2026 snapshot | Jobs supported across the airport precinct | 25,000 jobs | Across aviation, retail, logistics and hospitality. S1 |
| 2026 snapshot | Businesses operating at Auckland Airport | 300+ businesses | Airport precinct total. S1 |
| 2026 report | Economic output generated annually | NZ$39.5 billion | EY Auckland Airport Economic Analysis, cited by the airport. S1 |
| 2026 snapshot | Road network across the precinct | 24+ kilometres | Airport-owned roading network. S1 |
| 2026 snapshot | Floor area across two terminals | 170,000 square metres | Combined terminal floor area. S1 |
| 2026 snapshot | Runway length | 3,635 metres | Capable of handling all commercial aircraft types. S1 |
| 2026 snapshot | Hotels in the airport portfolio | 3 hotels | Includes two hotels held in a joint venture. S1 |
| 2026 snapshot | Combined hotel rooms | 772 rooms | Across three hotels. S1 |
| 2026 snapshot | Food and beverage operators | 40+ operators | Airport precinct and terminals. S1 |
| FY ended 30 Jun 2026 | Average commercial occupancy | 97 percent | Excludes sites reserved for future development. S1 |
| FY ended 30 Jun 2026 | Full-time permanent and fixed-term airport employees | 820 employees | Direct Auckland Airport employees. S1 |
| FY ended 30 Jun 2026 | Part-time permanent and fixed-term airport employees | 18 employees | Direct Auckland Airport employees. S1 |
| FY ended 30 Jun 2026 | Casual airport employees | 99 employees | Direct Auckland Airport employees. S1 |
| Since 2015 | Jobs secured through Ara Jobs and Skills Hub | 1,440+ jobs | Employment outcomes reported by Auckland Airport. S1 |
| Since 2015 | Rangatahi receiving skills training through Ara | 1,700 people | Cumulative figure. S1 |
| Since 2015 | People receiving training through Ara | 3,600 people | Cumulative figure. S1 |
Infrastructure and environment
Auckland Airport commissioned NZ$1 billion of projects in FY26 and reported 400,000 square metres of upgraded airfield, terminal and transport infrastructure. S2
| Period | Measure | Reported figure | Context and source |
|---|---|---|---|
| FY ended 30 Jun 2026 | Upgraded airfield, terminal and transport infrastructure | 400,000 square metres | FY26 programme delivery. S2 |
| FY ended 30 Jun 2026 | Projects commissioned | NZ$1 billion | Includes remote stands and stormwater and air-conditioning upgrades. S2 |
| FY ended 30 Jun 2026 | Scope 1 and 2 emissions reduction from 2019 baseline | 75 percent | Market-based methodology. S1 |
| FY ended 30 Jun 2026 | Aeronautical waste-to-landfill reduction from 2019 baseline | 22 percent | Reported environmental performance. S1 |
| FY ended 30 Jun 2026 | Households offered noise-reduction packages | 70 households | Statutory programme. S1 |
History and future
Auckland Airport marked 60 years in 2026 after passenger movements grew from 700,000 in 1966 to 18.9 million in calendar 2025. S3
| Period | Measure | Reported figure | Context and source |
|---|---|---|---|
| 1966–2026 | Years since Auckland Airport opened | 60 years | Opened 29 January 1966. S3 |
| 1966–2025 | Traveller movements since opening | 458 million | Cumulative figure reported for the 60th anniversary. S3 |
| 1966 | Annual traveller movements | 700,000 movements | Opening-year comparison. S3 |
| 2025 calendar year | Annual traveller movements | 18.9 million | Calendar-year comparison. S3 |
| Year ended Dec 2025 | New Zealanders departing internationally through AKL | 2.3+ million travellers | Outbound New Zealand travellers. S3 |
| 2026 construction programme | Construction workers on site each day | 1,500+ workers | Daily workforce at the time of publication. S3 |
| 2026 construction programme | Peak construction workforce | 2,500 workers | Expected/peak workforce. S3 |
| Integrated domestic terminal | Traveller processing-capacity increase | 44 percent | Planned terminal capacity uplift. S3 |
| Integrated domestic terminal | Domestic airline-seat capacity increase | 26 percent | Planned capacity uplift. S3 |
| Integrated domestic terminal | Additional flexible bus-lounge capacity | 10 percent | Planned additional capacity. S3 |
| Late 2040s forecast | Annual passengers supported | 38 million | Master Plan forecast. S7 |
New Zealand visitor context
Stats NZ recorded 3.69 million overseas visitor arrivals in the year ended July 2026, including a record 1.59 million from Australia. S4
| Period | Measure | Reported figure | Context and source |
|---|---|---|---|
| July 2026 | Overseas visitor arrivals to New Zealand | 256,600 arrivals | Up 20,100 from July 2025. S4 |
| July 2026 | Visitor arrivals versus July 2019 | 100.4 percent | First month since reopening to exceed the equivalent 2019 month. S4 |
| Year ended Jul 2026 | Overseas visitor arrivals | 3.69 million | Up 305,000 from the July 2025 year. S4 |
| Year ended Jul 2026 | Visitor arrivals from Australia | 1.59 million | A record for any July year. S4 |
| Year ended Jul 2026 | Visitor arrivals from Singapore | 66,000 arrivals | A record for any July year. S4 |
| Year ended Jul 2026 | New Zealand-resident traveller arrivals | 3.09 million | Up 32,000 from the July 2025 year. S4 |
| Year ended Jul 2026 | NZ-resident arrivals from Australia | 1.29 million arrivals | Up 45,000. S4 |
| Year ended Jul 2026 | NZ-resident arrivals from the United States | 135,000 arrivals | Down 30,000. S4 |
Peak travel periods
The 2025/26 summer peak was forecast to bring more than 2.5 million travellers through Auckland Airport over six weeks. S5
| Period | Measure | Reported figure | Context and source |
|---|---|---|---|
| 24 Jun–19 Jul 2026 | Expected international traveller movements | 680,000+ movements | Up 1.5% from the comparable 2025 period. S5 |
| 24 Jun–19 Jul 2026 | Expected domestic traveller movements | 570,000 movements | Down 3.5% from the comparable 2025 period. S5 |
| 27 Jun 2026 | Expected international departures on busiest day | 15,000 departures | Winter travel peak forecast. S5 |
| 3 Jul 2026 | Expected domestic departures | 14,000 departures | Up 2.7% from the prior winter-holiday peak. S5 |
| 3 Jul 2026 | Expected domestic arrivals | 13,000+ arrivals | Up 3% from the 2025 winter break. S5 |
| Winter school holidays 2026 | International arrivals across each of three weekends | 30,000 arrivals | Approximately 30,000 in each weekend. S5 |
| Winter school holidays 2026 | Transit passenger growth | 16 percent | Year-on-year growth. S5 |
| 8 Dec 2025–18 Jan 2026 | Expected total travellers | 2.5+ million travellers | Six-week summer peak. S6 |
| 8 Dec 2025–18 Jan 2026 | Expected domestic travellers | 1 million travellers | Summer peak forecast. S6 |
| 8 Dec 2025–18 Jan 2026 | Expected international travellers | 1.5 million travellers | Summer peak forecast. S6 |
| Summer 2025/26 | International traveller growth | 7.5 percent | Compared with the previous summer period. S6 |
| Summer 2025/26 | Domestic traveller growth | 4.7 percent | Compared with the previous summer period. S6 |
| Summer 2025/26 | Additional international seats | 207,000 seats | Additional scheduled capacity. S6 |
| Summer 2025/26 | Total international seat capacity | 5.8 million seats | Across 43 destinations. S6 |
Market trends
Auckland Airport reported 1.77 million international travellers across March and April 2026, 4% more than the same months in 2025. S8
| Period | Measure | Reported figure | Context and source |
|---|---|---|---|
| Mar–Apr 2026 | International travellers at Auckland Airport | 1.77 million | Up 4% year on year. S8 |
| Mar–Apr 2026 | Average international load factor | 86 percent | Up three percentage points year on year. S8 |
| Year ended Mar 2026 | Seat-capacity growth between Australia and Auckland | 4 percent | Supported by 11 additional Jetstar and Qantas flights per week. S8 |
| Year ended Mar 2026 | Australian holidaymaker growth | 9 percent | Reported by Auckland Airport. S8 |
Monthly traffic
Auckland Airport’s official updates recorded 1.78 million passengers in January 2026 and 1.56 million in April 2026. S9
| Period | Measure | Reported figure | Context and source |
|---|---|---|---|
| April 2026 | Total Auckland Airport passengers | 1,555,588 movements | Up 1% year on year. S9 |
| April 2026 | International passengers including transit | 845,978 movements | Up 1% year on year. S9 |
| April 2026 | Domestic passengers | 709,610 movements | Up 1% year on year. S9 |
| Rolling year to Apr 2026 | Total passengers | 19,118,771 movements | Up 2% from the prior rolling year. S9 |
| January 2026 | Total Auckland Airport passengers | 1,782,009 movements | Up 1% year on year. S10 |
| January 2026 | International passengers including transit | 1,085,363 movements | Up 2% year on year. S10 |
| January 2026 | Domestic passengers | 696,646 movements | Down 1% year on year. S10 |
| January 2026 | Total aircraft movements | 14,168 movements | Up 2% year on year. S10 |
Direct answers
Auckland Airport recorded 19.04 million passenger movements in the financial year ended 30 June 2026: 8.57 million domestic movements and 10.47 million international movements including transit passengers.
Auckland Airport reported 27 airlines serving 43 international destinations and 23 domestic destinations in FY26.
Auckland Airport handled 173,880 tonnes of international cargo in FY26, 3% more than in FY25.
Stats NZ recorded 3.69 million overseas visitor arrivals in the year ended July 2026, an increase of 305,000 from the previous July year.
Henderson Taxi independently compiled and maintains this resource using Auckland Airport and Stats NZ primary-source publications. Henderson Taxi is not Auckland Airport or Stats NZ.
The CSV can be used with source attribution. The original infographic may be republished with visible credit to Henderson Taxi and a link to this statistics page. Primary-source rights remain with their respective publishers.
This page was compiled and reviewed by the Henderson Taxi editorial team. Henderson Taxi has provided pre-booked Auckland transport since 2014 and maintains this independent research resource for travellers, writers and researchers. We are not affiliated with Auckland Airport or Stats NZ. The CSV may be reused with source attribution. The original infographic may be republished with visible credit and a link to this page. Primary-source rights remain with their publishers. Corrections: contact@hendersontaxi.co.nz.
Source register
Links were checked on 26 September 2026. PDF sources may open or download depending on your browser.
Auckland Airport · 20 August 2026
Open primary source ↗Auckland Airport · 20 August 2026
Open primary source ↗Auckland Airport · 29 January 2026
Open primary source ↗Stats NZ · 11 September 2026
Open primary source ↗Auckland Airport · June 2026
Open primary source ↗Auckland Airport · 11 December 2025
Open primary source ↗Auckland Airport · 1 July 2026
Open primary source ↗Auckland Airport · 19 May 2026
Open primary source ↗Auckland Airport · 15 May 2026
Open primary source ↗Auckland Airport · 16 February 2026
Open primary source ↗Travelling through AKL?
Pre-booked, door-to-door transport with child-seat and vehicle options.